Alignment between purpose, goals and metrics
I thought I’d share how we at factor10 see the connection between purpose, goals and metrics. What improvements can you come up with?

Metrics problems in companies
Goldratt wrote: “Tell me how you measure me and I’ll tell you how I will behave.” Despite this, companies often make life hard for themselves with how they measure. Often the metrics focus on measuring activities. That typically leads to measuring efficiency rather than effectiveness. Local optima rather than global optima. It measures and encourages full throttle without ever changing gear. That’s pointless, of course. Worse than that, it’s harmful.
Software metrics
Software development has had similar worries, but the Accelerate book has helped a lot! They suggest the following metrics for measuring “software delivery performance”:
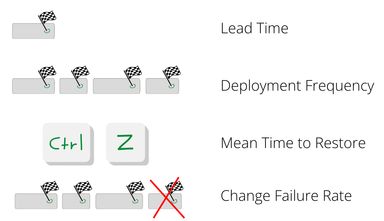
“Deployment Frequency”, for example, is a proxy metric. It’s not certain that customer value is actually created, but it’s a leading metric (one that can be measured early), which according to the research the book is based on is closely related to the lagging metric customer value (which, in other words, can only be measured long after the effort was made).
If you look at a single metric, it’s easy to improve. Release code of terrible quality quickly. That’s good for “Lead Time”. But it makes “Change Failure Rate” worse. The metrics are meant to balance each other. For example, even if you deploy frequently, you need to keep the failures down. In practice, it turns out that “Deployment Frequency” can often increase and “Change Failure Rate” decrease at the same time if you improve the 24 capabilities that the book has identified as the most important!
We work a lot with this kind of thing together with our customers, both when it comes to technology and business. Given that we find this interesting, what about the cobbler’s children? The question is whether we manage to get sensible metrics for ourselves (factor10) and our progress. And not least how well the metrics are “aligned” with our goals and our purpose. It’s time to tell you how it looks at our place. Let’s start with the purpose and work our way down.
Purpose/ambition
Our purpose is:
- We will help make the world radically better by becoming a role model in the software development industry.
It probably sounds cheesy to many, but every time I think about it I get goosebumps and feel that it’s right. :) Software is an area of leverage, as Kent Beck writes in the XP book. That’s part of the explanation for why the purpose is reasonable to strive for. It’s simply possible to achieve an incredible amount with leverage. Suppose, for example, that you come up with a development improvement that opens up a bottleneck, and that you then spread that knowledge since it can be used in many contexts and by many people. The effect becomes enormous. More sick people can be cared for better, more children get access to school, and so on. Only imagination sets the limits.
Goals
Our goals are:
- Customers choose us and stay with us because they want more from their business.
- People in the industry exchange ideas with us because they want more from their professional lives.
When these goals are met, we know we’re working in the direction of our purpose.
Furthermore, we have a goal (or constraint) for “don’t give away the company”. We call it a guardrail goal and it reads:
- Stable collective bonus for the employees (when the profit margin is >= 20%).
We also believe that goal is powerful when it comes to being seen as a role model. Despite having unconventional ideas, we can be highly profitable. Or rather… “Despite” should be changed to “thanks to”.
Metrics
Our metrics for the first two goals:
- Delivered customer value
- Score for Personal Exposure (PE)
The metrics for the guardrail goal are:
- Number of customers of a certain size
- Number of new customers
- Number of consultants
The first four metrics are leading and the fifth is lagging. We have tried, to a large extent, to choose/design the metrics to be leading. As the values of the leading metrics emerge, we get a continuous indication of how we’re meeting our goals rather than finding out long after the fact.
The PE metric
Let’s take a closer look at one of the metrics here, namely the PE metric. PE stands for Personal Exposure, and for us it means that working time and budget are set aside for consultants to blog, speak at conferences, work on open source, and so on. When a consultant, for example, publishes an article or gives a presentation at a conference, PE points are earned.
The PE metric is a proxy metric for the personal exposure we achieve in total for the whole team. Instead of measuring at the individual level, we think of articles and presentations as team work rather than individual work. For example, people are explicitly encouraged to get feedback from colleagues. It’s also extra important for us who are remote-first to stimulate collaboration.
Even after pair writing, we of course ask for feedback. Feedback is a gift, and it’s up to the receiver to decide what to do with it. When was the last time you wrote something that couldn’t easily be improved thanks to feedback from well-meaning and skilled people?
Instead of saying at the end of the year “next year we’ll get better at speaking at conferences, etc…”, we talk a little about how it’s going once a month. For 2022 we set three levels to gamify the whole thing a bit, in a fun way. When a level is passed, everyone gets a small gift. We recently passed the third level.
That was a short run-through of one of the metrics. If it’s of interest, I can write about the others too. By the way, we’re planning to add yet another metric, but more about that in another text.
What improvement opportunities can you spot right away? I’m grateful for any tips! And what does your “alignment” look like? It would be super interesting to hear about it!
This is a translation of the Swedish original, which has also been published on LinkedIn. Join the discussion here (in Swedish).